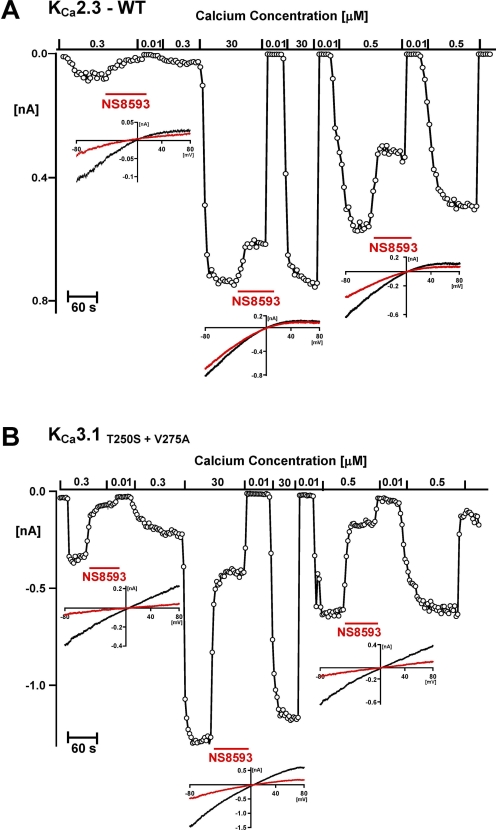
Fig. 5.
Inhibition of WT KCa2.3 (A) by NS8593 is more Ca2+-dependent than inhibition of the KCa3.1T250S+V275A mutant (B). Inside-out patches were exposed to a [Ca2+]i of 0.01, 0.3, 0.5, or 30 μM as indicated in the presence or absence of NS8593. The main figures show a continuous plot of the currents recorded at −75 mV. The inserts show control and NS8593 current traces. Experimental details and color-coding are as described in Fig. 1.

