
Figure 2.
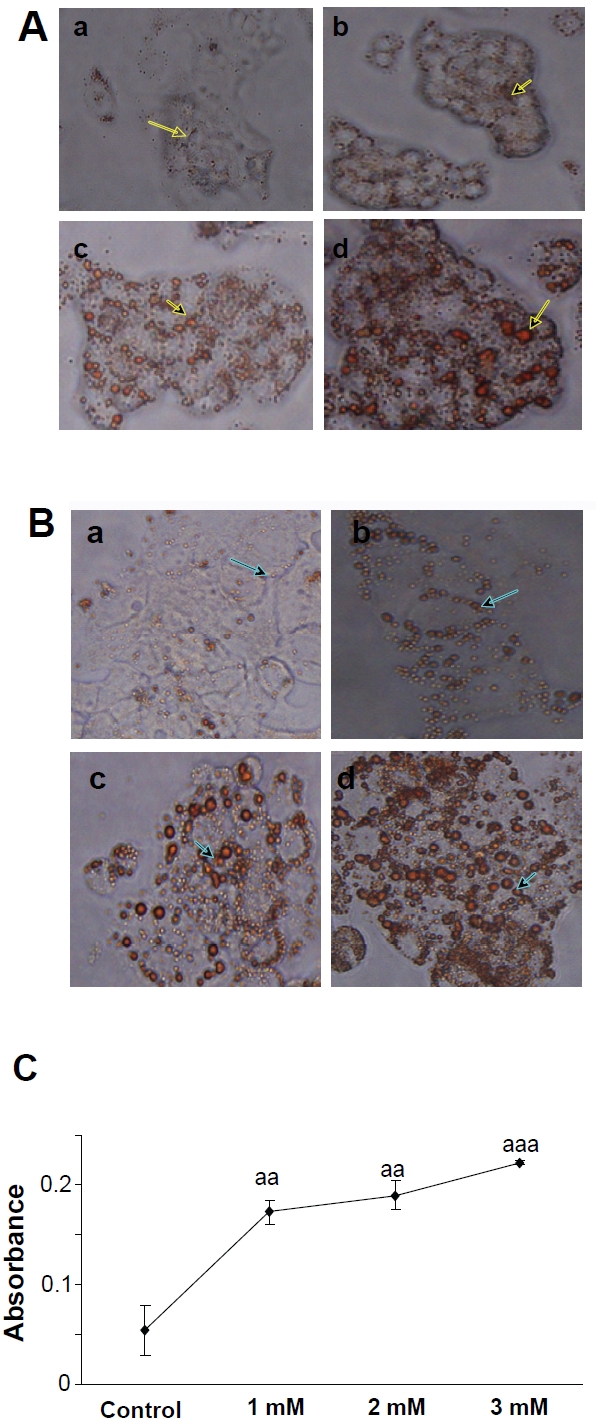
Observation of lipid accumulation in HepG2 cells by Oil-Red O staining after treating cells with various concentrations of FFAs for 24h. (A) Representative photomicrographs of HepG2 cells (×200). (a)Control cells; (b) Cells treated with 1mM FFAs; (c) Cells treated with 2mM FFAs; (d) Cells treated with 3mM FFAs; (B) Representative photomicrographs of HepG2 cells (×400). (a) Control cells; (b) Cells treated with 1mM FFAs; (c) Cells treated with 2mM FFAs; (d) Cells treated with 3mM FFAs; (C) After cells were treated for 24h,intracellular fat drops were read with spectrophotometer at 500 nm with Oil Red O staining, representing the mean ± SD of 3 independent experiments. aap < 0.01, aaap < 0.001vs control.