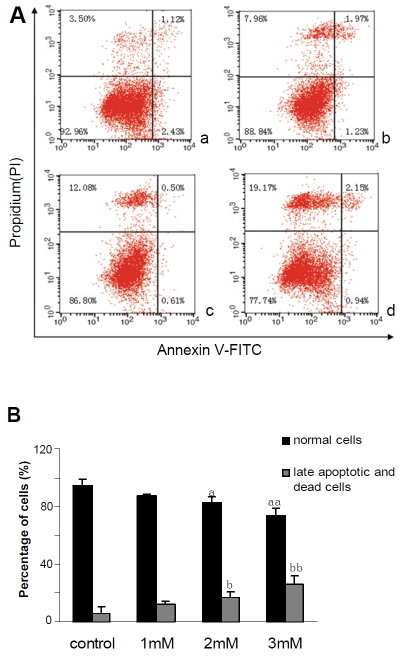
Figure 5.
Observation of FFAs-induced apoptosis by Annexin V-FITC/PI in HepG2 cells treated with different concentrations of FFAs. (A) The flow cytometry diagram of double-staining with Annexin V-FITC/PI staining, (a) Control cells; (b) 1mM FFAs; (c) 2mM FFAs; (d) 3mM FFAs. The normal control, early apoptotic, late apoptotic, and necrotic cells were present in the lower left, lower right, upper right, and upper left quadrant, respectively. The percentage of cells in each quadrant is indicated. (B) Quantitive detection of FFAs-induced apoptosis by Annexin V-FITC/PI staining. Each value represents the mean±SD of 3 independent experiments. Comparison of the percentages of normal cells. ap < 0.05, aap < 0.01 vs. control; Comparison of the percentages of late apoptotic and necrotic cells. bp < 0.05, bbp < 0.01 vs. control.

