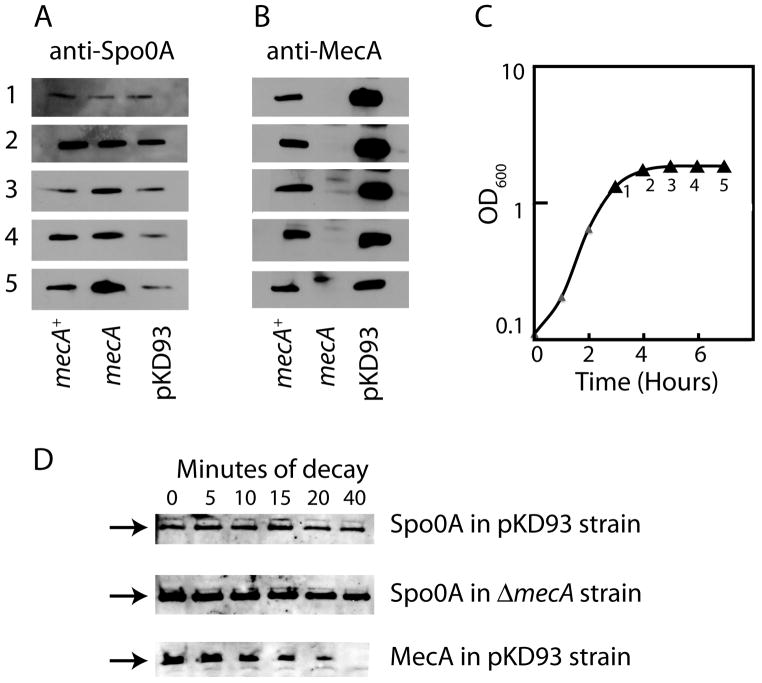
Fig. 6.
Detection of Spo0A protein by immunoblotting in wild-type (BD2149), mecA::erm (BD2148) and pKD93 (PP493) strains. The cultures were grown in DSM and samples were taken at the times indicated on the growth curve (panel C) for immunoblotting with anti-Spo0A and anti-MecA antisera (panels A and B respectively. The three strains grew identically and a curve is shown only for the wild-type strain. Equal amounts of protein were loaded in each lane. (D) BD2148 and PP493 were grown in DSM to just after T1 and puromycin (200 mg/ml) was added to inhibit protein synthesis. Samples were taken for blotting with anti-Spo0A antiserum (both strains) and with anti-MecA antiserum (PP493 only) at the indicated times. The arrows show the position of the Spo0A (top two panels) and Mec (bottom panel) signals.

