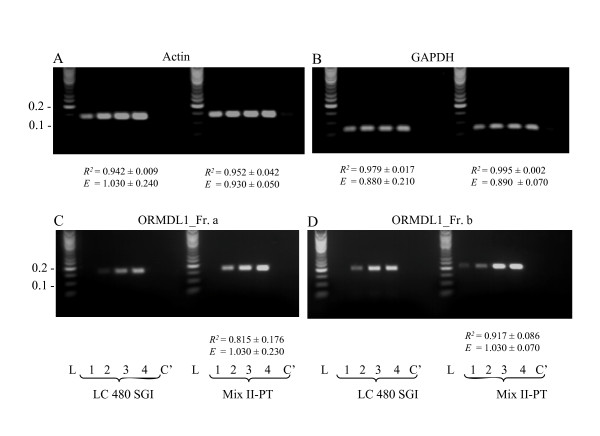
Figure 5.
Enhanced performance of PCR mix II-PT in routine qPCR amplifications. cDNA from mouse bone marrow-derived mast cells was prepared, diluted 1:105 (1), 1:104 (2), 1:103 (3) or 1:102 (4) and amplified in SGI-supplemented PCR mix II-PT or LC 480 SGI using primer sets for Actin, GAPDH, ORMDL1_Fr. a or ORMDL1_Fr. b. In controls (C'), cDNA was replaced by H2O. The samples were analyzed by qPCR followed by agarose gel electrophoresis and staining with ethidium bromide. Lane L, DNA standard ladder with sizes indicated in kbp on the left. Regression coefficients (R2) and efficiencies (E) were calculated from the plots of Cq values versus log copy numbers and are presented only for samples with the expected melting temperature at all template dilutions. Data are presented as means ± S.D. calculated from three independent experiments performed in triplicates.

