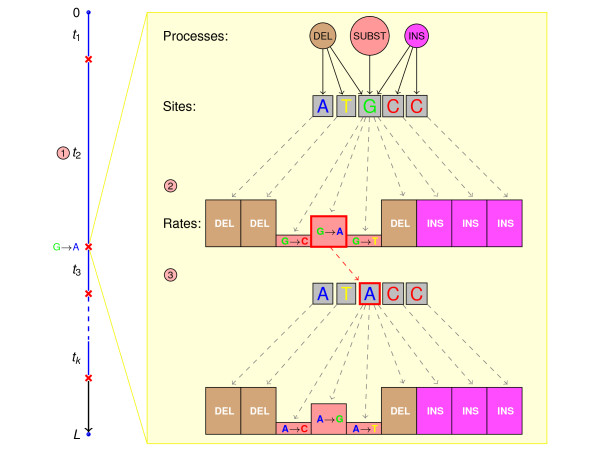
Figure 1.
Illustration of the Gillespie algorithm. ① The rate at which the next event occurs is equal to the sum of the rates of all possible events; the time, tk, until event k occurs is randomly chosen and the simulation ends if the event would have occurred after the end of the branch (L). ② The actual event that occurs is randomly selected, each event having probability proportional to its rate. The figure highlights the event k = 2, a G→A substitution at the third site of the evolving sequence. ③ The selected event is applied to the sequence, the set of possible events and their rates are updated and the next inter-event time (t3) drawn.

