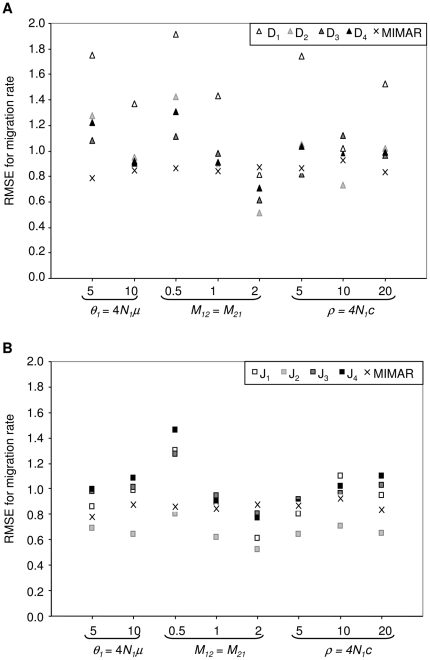
Figure 3. RMSE for the estimate of migration rate (M12 = M21) as a function of the population mutation rate (θ), values of simulated migration rate (M12 = M21) and population recombination rate (ρ).
The RMSE is computed across 140 datasets with fixed divergence time at τ = 0.1. (a) for the four maximum likelihood methods (D1–D4) and MIMAR, (b) for the four composite-likelihood methods (J1–J4) and MIMAR.

