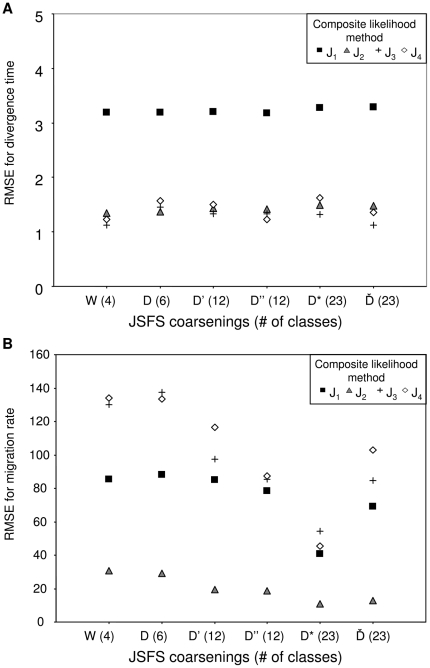
Figure 5. Power analysis of the various JSFS coarsenings to estimate divergence time and migration rates for 100 datasets of 7 loci.
RMSE are computed for estimates of (a) the divergence time, and (b) migration rates (M12≠M21) for the four composite-likelihood methods (J1–J4) based on six vectors of summary statistics. The vector W is defined by the four Wakeley-Hey classes from Eq. 2, and other vectors D, D′, D″, D* and Ď are refined decompositions of the JSFS with higher numbers of classes.

