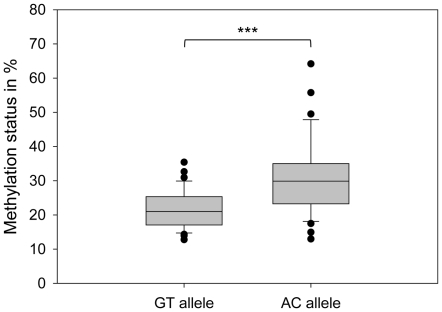
Figure 2. Allele-specific DNA methylation at MCHR1.
The box plot shows average methylation levels of the GT and the AC allele observed in 49 individuals, comprised of 18 homozygous for GT, 13 homozygous for AC and 18 heterozygotes. The median methylation level for the GT allele is 20.9% and for the AC allele 29.9%. This difference is significant (***: P<0.001, Mann-Whitney-test). The methylation analysis was done by PCR on bisulfite treated DNA. PCR products were cloned and sequenced. We analyzed on average 41 clones per individual. The methylation level for each allele per individual was calculated by dividing the number of methylated sites in all clones harboring the respective allele by the number of possible methylation sites.

