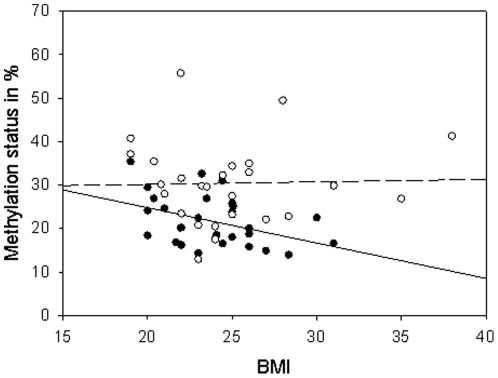
Figure 5. BMI-dependent DNA methylation levels at MCHR1.
Allele specific methylation levels plotted against BMI of 39 individuals. The methylation status of the GT allele shows a significant negative correlation with BMI (r = −0.814, P = 0.024, Pearson correlation), whereas the methylation of the AC allele does not change with increasing BMI (r = 0.057, P = 0.897, Pearson correlation).

