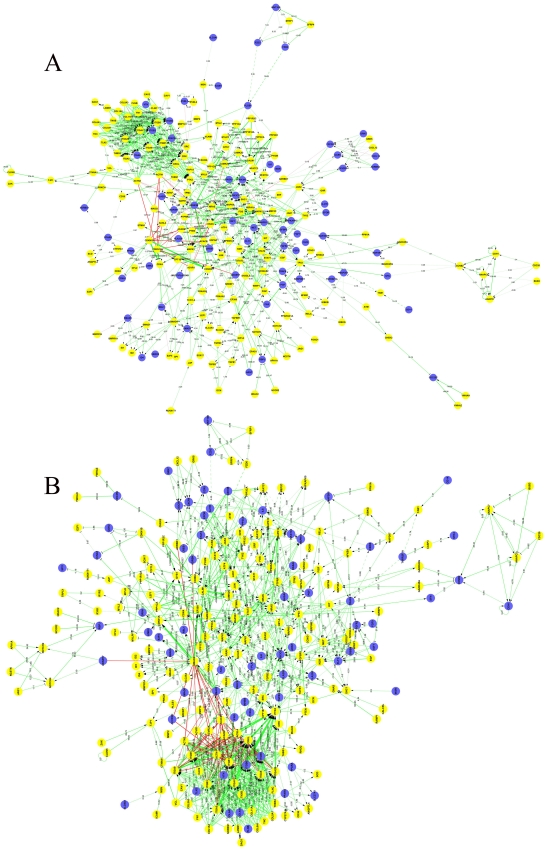
Figure 7. The interaction network between the differentially expressed muscle developmental genes.
(A–B) Signal-flow analyses of myogenesis-related genes in LR (A) and LT (B). Yellow dots indicate DE genes and blue dots indicate non-DE genes. Straight lines indicate interaction relationships between genes; area indicates active and flat indicates inhibited. Solid line indicates a direct interaction and dashed line indirect interaction. Value and diameter of line indicates the size of interaction; the larger the values the stronger the regulation.

