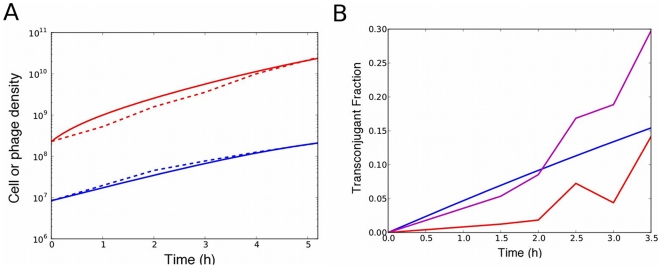
Figure 6. Model and experimental data for phage replication in F+ culture (all cells infected).
(A) Replication rate of phage. The y-axis is the phage (red) or cell (blue) concentration over time. Experimental data are shown with the dotted lines; model fit is shown with the solid lines (kr = 60 /hr, RMSD = 3×10⁹ units/mL). (B) Model of inhibition of conjugation by replicating phage: Example of conjugation data (in this example, M13-kmR was added to 109 pfu/mL; cells were pre-infected), with fit to determine R and ki. Data are shown in red and purple (two replicates), with model fit shown in blue (R = 0.2, ki = 10−8 /hr; RMSD over all conjugation trials = 0.32).

