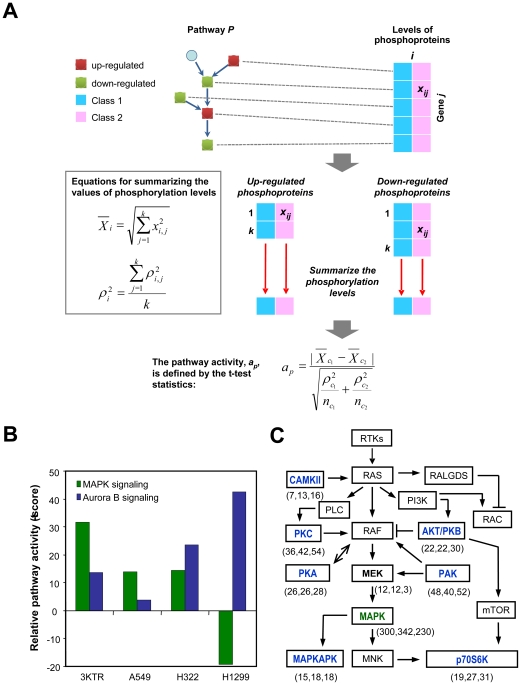
Figure 4. Inferring pathway activity in Ras-transformed HBECs and NSCLC cells.
(A) The levels of regulated phosphoprotein signatures obtained from quantitative proteomics analysis were subjected to pathway activity analysis. Equations for summarizing the levels of phosphorylated proteins and for analyzing pathway activity are shown. xi,j and ρi,j are the mean and standard deviation, respectively, of the value of the phosphoprotein j in class i, and k is the number of proteins in a given pathway. ap is the activity score for pathway p between classes c1 and c2, and  and
and  are the numbers of replicate experiments for the respective classes. In our case,
  and
and  are each 3. (B) Inferred activities of MAPK and Aurora B signaling pathways in Ras-transformed HBECs and NSCLC cells in comparison with HBEC-3KT are shown as relative pathway activity scores (t-scores). (C) The involvement of the Ras/Raf/MEK/MAPK signaling pathway and its cross-talk with basophilic kinases in NSCLC cells. Kinases identified as being upstream of the regulated phosphosites by NetworKIN analysis in this study are highlighted in bold font. Kinases targeting proline-directed and basophilic S/T sites are labeled in green and blue letters, respectively. The frequencies of the individual kinases identified in A549, H322, and H1299 cells in comparison with HBEC-3KT are shown in parentheses.

