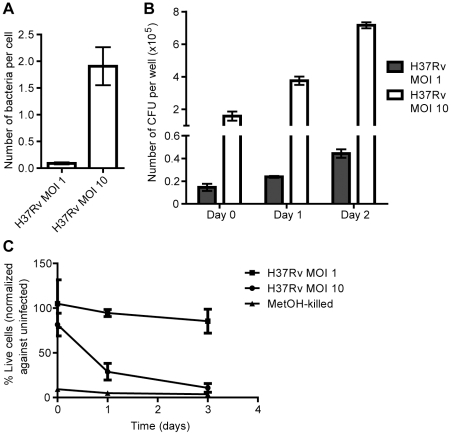
Figure 1. Phagocytosis, replication and cell death.
hMDMs were infected with luciferase-expressing H37Rv at MOI 1 or 10 for up to three days. Bacterial numbers were assessed by luminometry, and macrophage viability by calcein AM staining and fluorescence intensity measurement. A) Comparison of the number of bacteria phagocytosed per cell after 4 h at the different MOIs (n = 9). B) Comparison of the number of intracellular H37Rv over two days at MOI 1 and 10 (n = 3). C) Relative viability of hMDMs infected with H37Rv at MOI 10 or 1 over three days (n = 3). The values were normalized against uninfected controls from the same reading, which were set to 100%. Values from methanol-treated cells are shown for comparison. Bar graphs show the mean and SEM.

