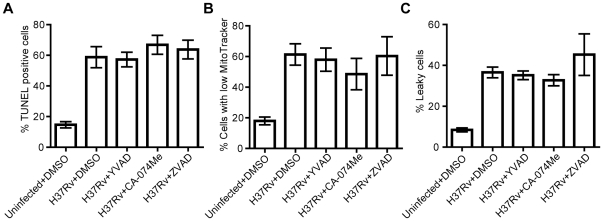
Figure 4. Effect of inhibitors on cell death.
hMDMs were treated with DMSO (1:1000) or inhibitors (50 µM) dissolved in DMSO, and infected with H37Rv at MOI 10 or left uninfected. After two days, the features of cell death were analyzed using three different staining procedures and flow cytometry. A) TUNEL analysis of DNA fragmentation (n≥4). B) MitoTracker analysis of mitochondrial membrane potential loss (n≥4). C) Plasma membrane integrity analysis (n≥4). Bar graphs show the mean and SEM. The means were compared to that of H37Rv-infected and DMSO-treated hMDMs using ANOVA with Dunnett’s post-hoc test.

