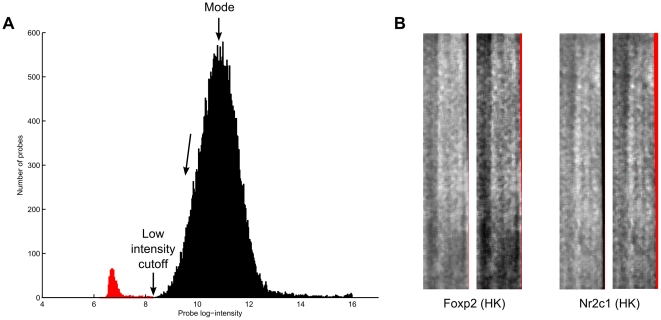
Figure 4. Low intensity probe filtering.
(a) A filter cutoff point is determined based on the intensity histogram. (b) Two examples of how low intensity filtering successfully removes dark edge artifacts in PBM samples. In both samples pairs, the original sample is on the left, and the filtered sample on the right. Red pixels indicate missing or discarded intensity values.

