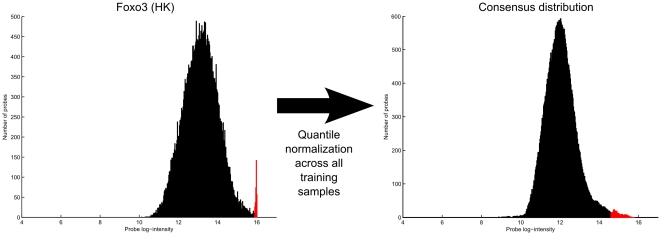
Figure 6. Quantile normalization recovers high intensity tails in saturated samples.
The figure shows how the log-intensity histogram of the Foxo3 PBM sample is changed by quantile normalization. An example of how quantile normalization can recover the high intensity tails in saturated PBM samples. The saturated probe intensities (highlighted in red) are recovered by fitting them to the consensus distribution.

