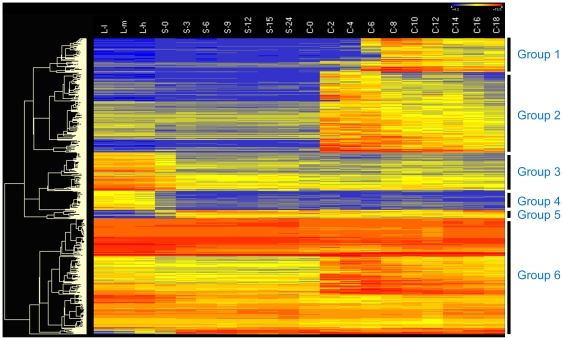
Figure 5. The heatmap of the 1200 hub genes in TGN.
The heatmap was clustered by Euclidean distance of expression. The levels of expression are illustrated by different grades of color as determined from microarray data indicated along the top (from left to right). The color scale is as follows: dark color, low expression; light color, high expression. Levels of expression were obtained for 20 points in time during three physiological/developmental stages of the life cycle of Tetrahymena: For growing cells, L-l, L-m and L-h correspond to ∼1×10⁵ cells/ml, ∼3.5×10⁵ cells/ml and ∼1×10⁶ cells/ml, respectively. For measurements of expression during starvation, ∼2×10⁵ cells/ml were collected at intervals of 0, 3, 6, 9, 12, 15 and 24 hours (referred to as S-0, S-3, S-6, S-9, S-12, S-15 and S-24, respectively). For measurements of expression during conjugation, equal volumes of B2086 and CU428 cells were mixed following 18 h of starvation, and samples were collected at intervals of 0, 2, 4, 6, 8, 10, 12, 14, 16 and 18 h after mixing (referred to as C-0, C-2, C-4, C-6, C-8, C-10, C-12, C-14, C-16 and C-18, respectively). The 1,200 genes were sorted into six groups according to clustering analysis.

