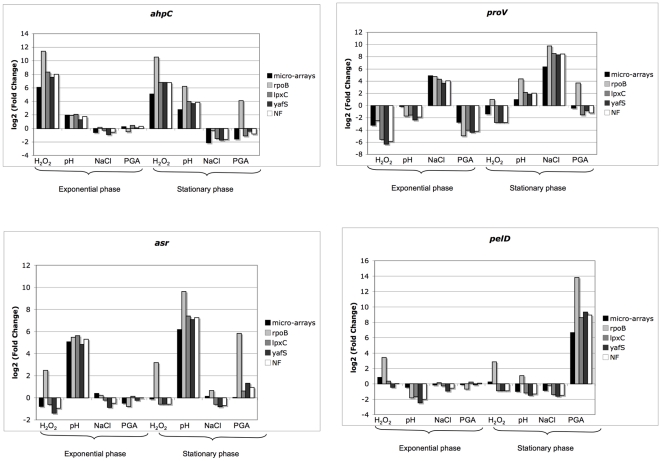
Figure 5. Relative expression levels of selected target genes.
The relative expression levels of the four genes, ahpC, proV, asr and pelD, were measured and calculated following different normalization strategies: with rpoB in pale gray, with lpxC alone in gray, with yafS alone in dark gray and with the geometric mean of lpxC and yafS in white. Growth conditions were chosen to induce at least one of the four marker genes.

