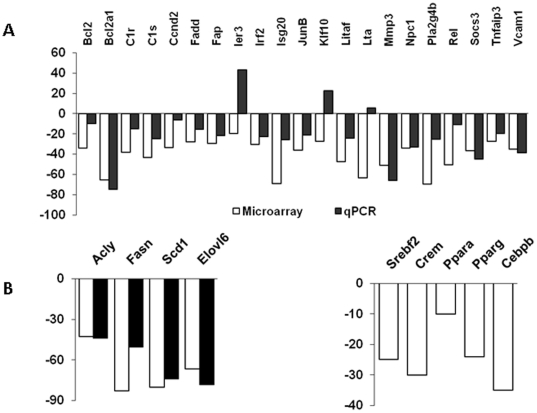
Figure 2. qPCR validation of microarray data.
A. qPCR validation of select genes from overlapping set (from Table 1); B. Expression of lipogenesis genes and transcription factors in olr1 KO mice. White bars – microarray data; black bars – qPCR data. All P values<0.05.

