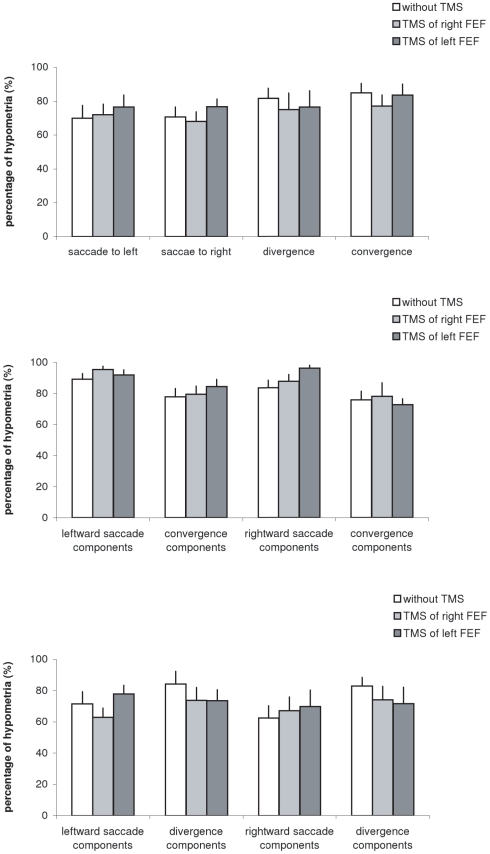
Figure 4. Mean values of percentage of hypometria with standard error.
(A) for saccades to left, saccades to right, divergence and convergence, (B) for combined convergent movements and (C) for combined divergent movements under the three experimental conditions: no-TMS, TMS over the right, or the left FEF.

