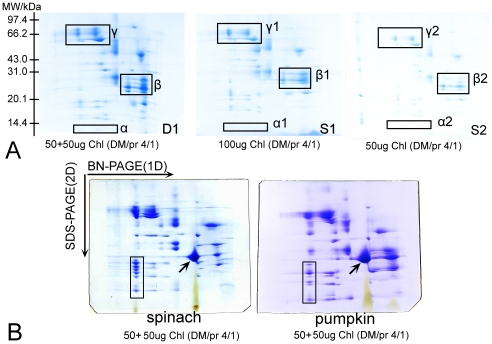
Figure 3. Resolution comparison between “single-strip BN/SDS-PAGE” and "double-strips BN/SDS-PAGE” with membrane proteins.
A: Comparison of 2D gels pattern between “Single-strip BN/SDS-PAGE” and “Double-strips BN/SDS-PAGE” in rice. (D1): The pattern of “Double-Strips BN/SDS-PAGE” with two 1D BN-Gel lane strips each loaded with 50 µg chlorophyll dissolved at DDM/protein ratio of 4/1. (S1): The pattern of “Single-Strip BN/SDS-PAGE” with one 1D BN-Gel strip loaded with 100 µg chlorophyll dissolved at DDM/protein ratio of 4/1. (S2): The pattern of “Single-Strip BN/SDS-PAGE” with one 1D BN-Gel strip loaded with 50 µg chlorophyll dissolved at DDM/protein ratio of 4/1. (Parts of regions α, β and γ in the panels of 2D SDS-gels represent the obvious difference between these methods). B: The pattern of the thylakoid membrane proteins from Spinacia oleracea and Cucurita spp. separated by “Double-Strips BN/SDS-PAGE”. The amounts of chlorophyll and detergent/protein ratios were labelled in the panels.

