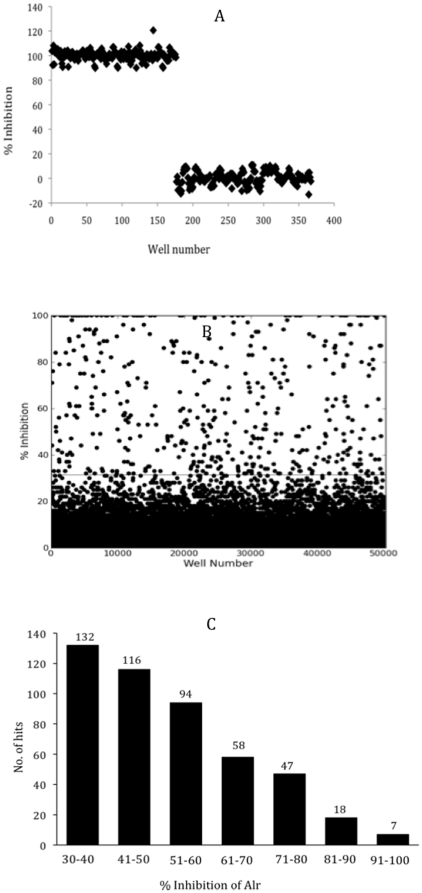
Figure 4. Summary of HTS outcome.
(A) Results of positive and negative controls plotted for 367 representative wells of the alanine racemase assay. The positive control represents 100% inhibition (wells 1–176) and the negative control represents 0% inhibition in the presence of 1% DMSO (wells 177–367). (B) HTS data for one of the two replicates for the entire 53,000-compound screen, obtained from 138 384-well plates. The line indicates the 30% inhibition cut-off for hit selection. A similar distribution of positive and negative controls results were obtained for the coupling enzyme assay (data not shown). (C) Distribution of the 267 hits, with the hits categorized into 7 groups with respect to percent inhibition.

