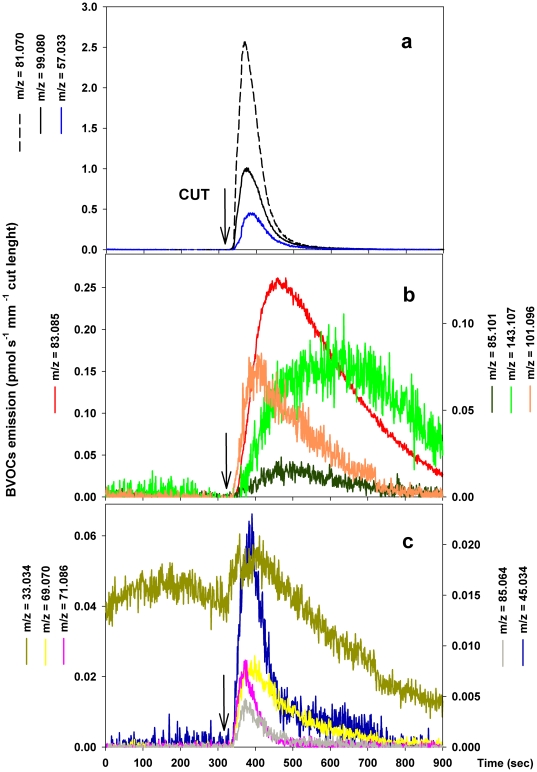
Figure 1. Time course of BVOCs emitted from wounded Dactlylis glomerata leaves PTR-TOF detected during the same measurement.
Different colors and symbols indicate different ions: (a) m/z = 81.070+m/z = 99.080 [(Z)-3-hexenal+(E)-3-hexenal]; m/z = 57.033 (E)-2-hexenal; (b) m/z = 83.085+m/z = 101.096 [(Z)-3-hexenol+(E)-3-hexenol+(E)-2-hexenol+hexanal]; m/z = 85.101 [hexanol]; m/z = 143.107 [(Z)-3-hexenyl acetate+(E)-2-hexenyl acetate]; (c) m/z = 33.034 [methanol]; m/z = 45.034 [acetaldehyde]; m/z = 85.064 [pentenone]; m/z = 69.070 [isoprene] and m/z = 71.086 [pentenal fragment]. Data shown are from a single leaf but are representative of experiments replicated four times on different leaves.

