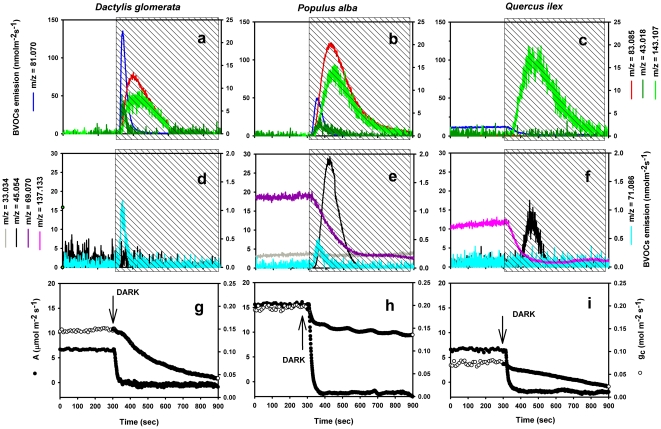
Figure 4. Time course of BVOC emission and gas exchange of intact Dactlylis glomerata (a, d, g), Populus alba (b, e, h) and Quercus ilex (c, f, i) leaves following rapid light-dark transitions.
The light was switched off at the time indicated by the arrows. Different colors indicate different ions: (a, b, c) m/z = 81.070 [(Z)-3-hexenal+(E)-3-hexenal]; m/z = 83.085 [(Z)-3-hexenol+(E)-3-hexenol+(E)-2-hexenol+hexanal]; m/z = 43.018 [hexyl acetates]; m/z = 143.107 [(Z)-3-hexenyl acetate+(E)-2-hexenyl acetate]. (d, e, f) m/z = 33.034 [methanol]; m/z = 45.054 [acetaldehyde]; m/z = 69.070 [isoprene] (only in P. alba - panel e); m/z = 71.086 [pentenal fragment]; m/z = 137.133 [monoterpenes] (only in Q. ilex - panel f). (g, h, i) Photosynthetic carbon assimilation (black circles) and stomatal conductance (open circles). One typical sequence out of four independent experiments is shown.

