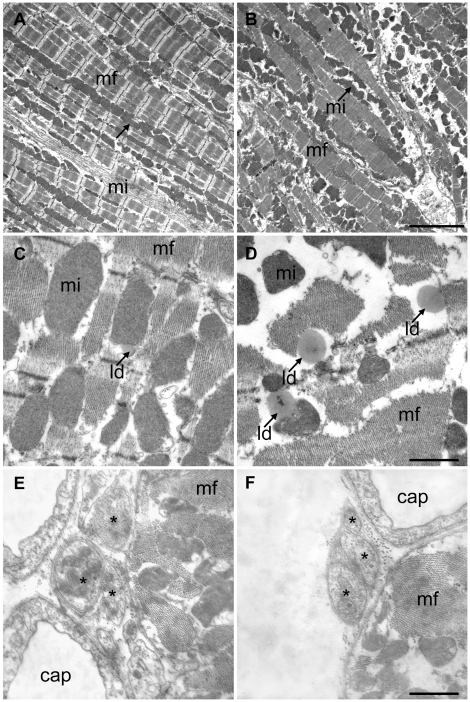
Figure 2. Ultrastructure of cardiomyocytes and nerve fibers.
Electron micrographs of myocardium from control (A, C, E) and tumor-bearing mice (B, D, F). A and B demonstrate the the increased volume of sarcoplasm and the loss of myofibrils in more or less longitudinally sectioned myocytes. Scale bar = 5 µm. C and D clearly show the increase in lipid droplet (ld) size and number in the tumor group in diagonally sectioned myocytes. Scale bar = 1 µm. E and F show nerve fibres containing three axons (asterisk) each. There were no apparent differences in the morphology. The neighbouring myocytes are more or less transversely cut. Abbreviations: cap = capillary, mf myofibrils, mi = mitochondria.

