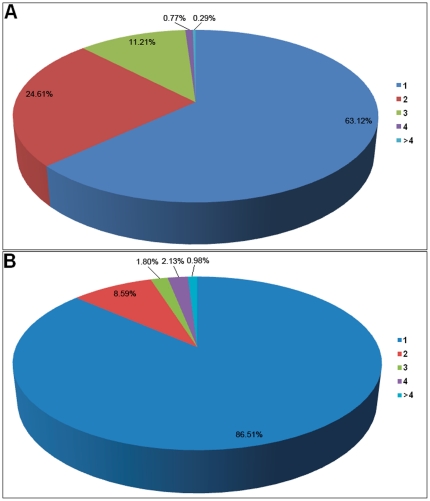
Figure 1. Pie chart illustrating the frequency of cross-mapping.
The legends at the right show the number of mapping loci. (A) Frequency of cross-mapping based on known human miRNA precursors through the analysis of high-throughput sequencing data. 36.88% of sequencing reads are simultaneously mapped to two or more different miRNA precursors, with some mapped to over 10 candidate loci. (B) Frequency of cross-mapping based on accurate alignments of known human miRNAs and precursors. Most miRNAs (86.51%) are found in corresponding miRNA precursors; but, 165 miRNAs were detected through the phenomenon of multiple mapping events between different pre-miRNAs. Although multicopy miRNA precursors and homologous miRNA genes contribute to cross-mapping, the fact that miRNAs can be located on opposite strands of pre-miRNAs is also an important factor.

