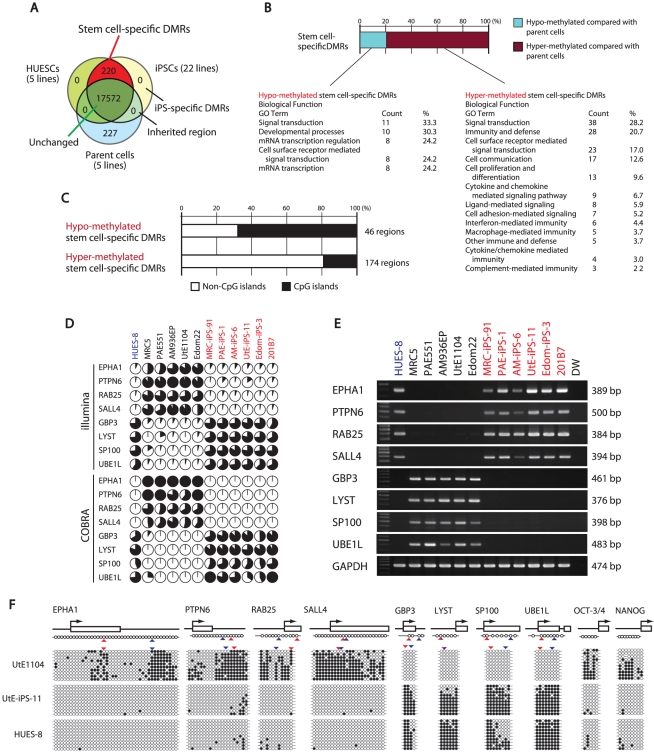
Figure 2. Defining stem cell-specific DMRs as novel epigenetic iPS markers.
(A) Venn-like diagram showing overlapping CpG sites among ESCs, iPSCs and their parent cells. The 220 overlapping sites are stem cell-specific differentially methylated regions (DMRs). Notably, neither overlapping iPSCs-specific DMRs nor inherited regions in iPSCs from the parent cells were observed. (B) Proportion of the hyper- and hypo-methylated stem cell-specific DMRs and GO analysis. Approximately 80% of the regions were hyper-methylated in iPSCs, compared with that of the parent cells. (C) Proportion of the regions associated with CpG islands and non-CpG islands in the hypo-methylated stem cell-specific DMRs. The hypo-methylated regions were biased to CpG islands, whereas the hyper-methylated regions were biased to non-CpG islands. (D) DNA methylation levels in the 8 representative genes determined by Illumina Infinium HumanMethylation27 assay and Bio-COBRA. These 8 genes were defined as SS-DMRs with significant changes of expression and were described in Table S6. The relative amount of methylated and unmethylated DNA ratio is indicated as the black and white area, respectively, in the pie chart. (E) Expression of the 8 genes. Expression of the 8 genes had an inverse correlation with DNA methylation level. (F) Bisulfite sequencing analysis of the 8 genes in endometrial cells (UtE1104), UtE-iPS-11 and HUES-8 cells. (Top) Schematic diagram of the genes. Arrows, open boxes and open circles represent transcription start site, first exon and position of CpG sites, respectively. (Bottom) Open and closed circles indicate unmethylated and methylated sites, respectively. Red and blue arrowheads represent the position of CpG sites in Infinium assay and COBRA assay, respectively.

