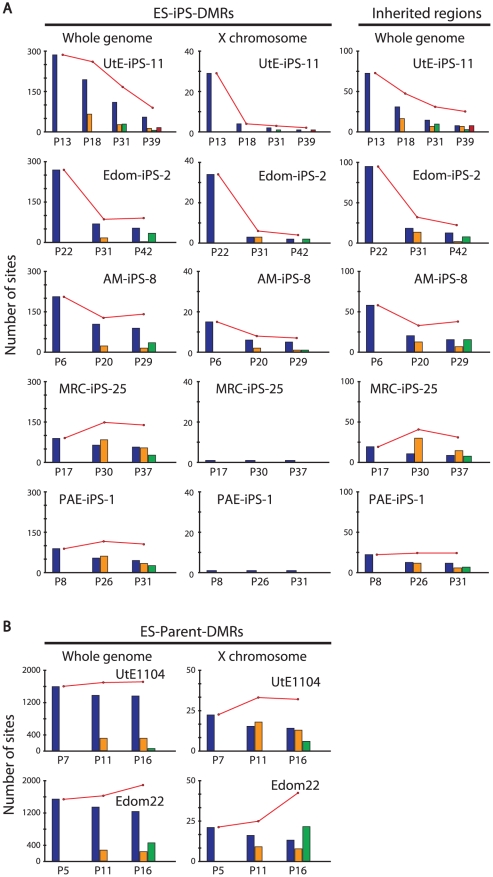
Figure 5. Number of the ES-iPS-DMRs and ES-parent-DMRs with passaging.
(A) Number of the ES-iPS-DMRs with passaging. Red line plots indicate total number of the ES-iPS-DMRs. Blue bars indicate the number of the ES-iPS-DMRs that appeared at the earliest passage. Orange, green and red bars indicate the number of the ES-iPS-DMRs that appeared secondarily at later passages. Appearance/disappearance of the ES-iPS-DMRs and inherited regions were repeated, but the number of newly-appeared ES-iPS-DMRs was decreased with passaging. (B) Number of the ES-parent-DMRs with passaging. Blue bars indicate the number of the ES-parent-DMRs at P5 (or P7). Orange and green bars indicate de novo ES-parent-DMRs at P11 and P16, respectively.

