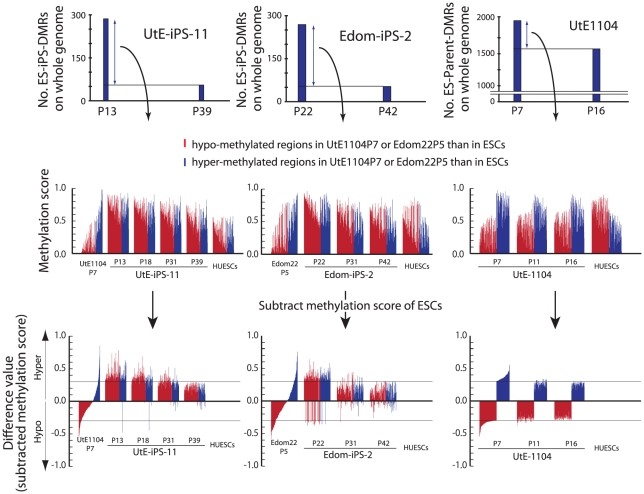
Figure 6. Hyper-methylation in the ES-iPS-DMRs and ES-parent-DMRs.
ES-iPS-DMRs that disappeared in UtE-iPS-11 and Edom-iPS-2 at the latest passage (upper) were analyzed and the methylation score of each ES-iPS-DMR was plotted on bar graph (middle). To clearly compare methylation scores, difference value were estimated by subtracting the scores of ESCs from that of each sample (lower). Red and blue bars represent hypo- and hyper-methylated regions, respectively, in the parent cells, compared with ESCs. Notably, almost all the regions, even though their difference values were hypo-methylated in the parent cells, became hyper-methylated in iPSCs at the early passage, and then their methylation levels were adjusted to the level of ESCs with passaging, i.e. subtracted methylation score became close to zero. This transiently-induced hyper-methylation was not detected in parent cells.

