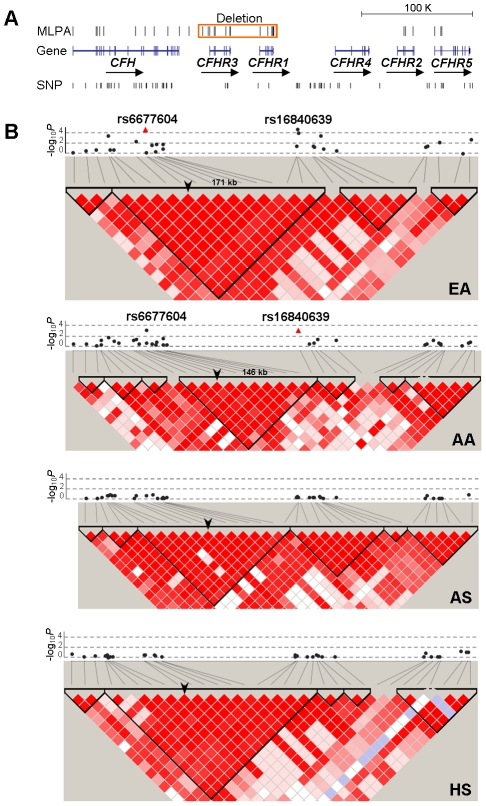
Figure 1. Allelic association of SNPs in the CFH-CFHRs region with SLE and their LD patterns.
A) The genomic structure of the CFH-CFHRs region and the location of all SNP and MLPA markers are indicated. The deletion of CFHR3 and CFHR1 detected by MLPA markers is shown as a red box. B) The allelic P value of each SNP with SLE (−log10 P) is plotted as a black circle according to its coordinate. The two SNPs exhibiting the strongest association with SLE in EA (rs6677604) and AA (rs16846039) are highlighted as red triangles. SNPs that failed in the HWE testing or showed low genotyping quality are not shown. SNP-constructed haplotype blocks were defined by Haploview using the confidence intervals model. An arrowhead is used to indicate the position of rs6677604 in the haplotype blocks.

