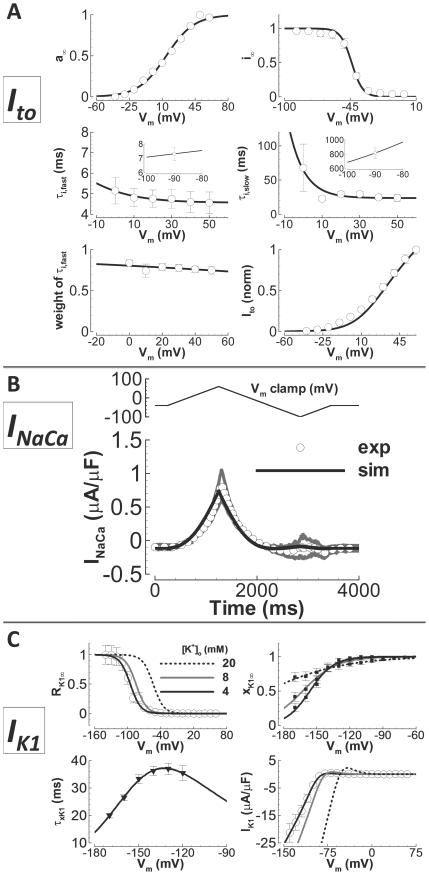
Figure 2. Undiseased human Ito, INaCa, and IK1 experiments and model validation.
A) Ito. Experimental data are white circles (N = 8 from 5 hearts for inactivation time constants, N = 10 from 5 hearts for recovery time constants, N = 9 from 6 hearts for steady state inactivation, and N = 23 from 8 hearts for the I–V curve). Simulation results are solid lines. From left to right, top to bottom: steady state activation, steady state inactivation, fast time constant for inactivation, slow time constant for inactivation (insets show fast and slow recovery from inactivation), relative weight of the fast component for inactivation and the I–V curve (normalized). B) INaCa. Experimental data are digitally averaged time traces (N = 3 from 2 hearts, white circles, gray is standard error of the mean). Simulation results are the solid line. Top) Voltage clamp protocol. Bottom) INaCa in response to the clamp. C) IK1. Experimental data are previously unpublished (white circles, N = 21 from 12 hearts), from Bailly et al.[37] (black squares) and Konarzewska et al.[38](black triangles). Simulation results are solid lines (black, gray and dashed black for [K+]o = 4, 8 and 20 mM). Top left) Voltage and [K+]o dependence of steady state rectification. Top right) Voltage and [K+]o dependence of steady state inactivation. Bottom left) Time constant for inactivation. Bottom right) I–V curve, and its [K+]o dependence.

