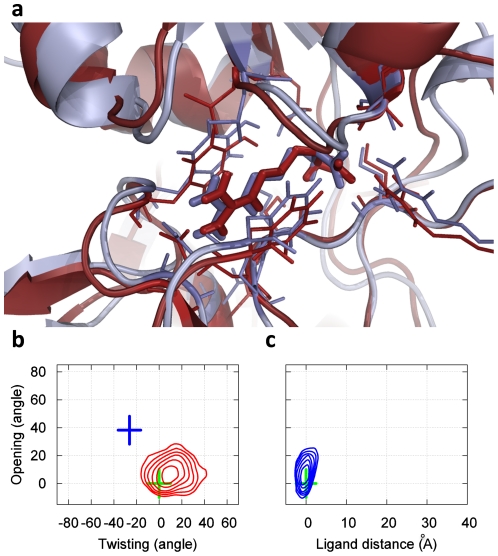
Figure 2. The bound state of our MSM for LAO binding (which is also the most populated state, having an equilibrium population of 74.9%).
(a) A snapshot from our simulations (red) achieves a 1.2 Å RMSD to the X-ray bound state (blue, PDB ID: 1LAF). The RMSD is computed from the protein Cα atoms that are within 8 Å to the center of mass of the ligand in the X-ray bound state (Residues 9–15, 17–19, 30, 50–53, 55–56, 67–74, 77, 83, 88, 90–92, 117–124, 141–143, 159–162, 164, 190–191 and 194–196). If all-protein Cα atoms are included the RMSD is 1.8 Å. (b) Free energy plot of the protein opening angle versus twisting angle. The bin size is (5°, 5°), and the interval between two adjacent contour levels is 0.5 KT. The green and blue crosses correspond to X-ray structures of the bound and apo conformations respectively. (c) Free energy plot of the opening angle versus the distance between the ligand and the binding site. The bin size is (1.5 Å, 5°), and interval between contour levels is 0.5 KT.

