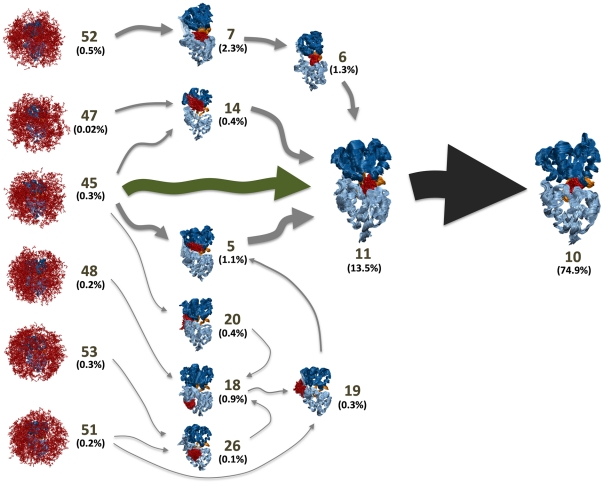
Figure 3. Superposition of the 10 highest flux pathways from the unbound states to the bound state.
The flux was calculated using a greedy backtracking algorithm [31], [66] applied to a 54-state MSM generated with the SHC algorithm [30]. These pathways account for 35% of the total flux from unbound states to the bound state. The arrow sizes are proportional to the interstate flux. State numbers and their equilibrium population calculated from MSM are also shown. The conformational selection and induced pathways from the unbound states to the encounter complex state is shown in green and grey arrows respectively.

