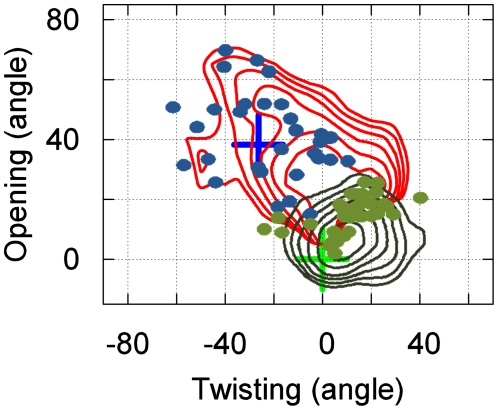
Figure 6. Overlay of free energy plots of the protein opening angle versus twisting angle for the encounter complex (red) and bound state (blue).
Green dots correspond to where transitions from the encounter complex to the bound state occur. Blue dots correspond to where transitions into the encounter complex from other states occur. Only transitions without re-crossing are counted (minimum residence time in the final state after the transition is 6 ns).

