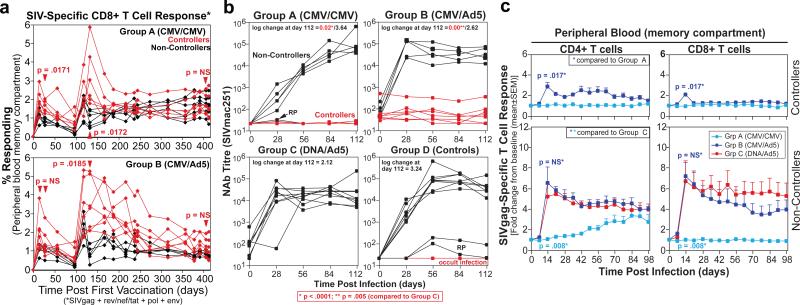
Figure 2. Immunologic correlates of RhCMV/SIV vector-associated control.
a, Analysis of total SIV-specific CD8+ T cell responses in the blood memory compartment during the vaccine phase of Group A and B RM with differences in the magnitude of these responses between controllers and non-controllers at the designated time points determined by the Wilcoxon rank sum test. b, Comparison of the anti-SIVenv antibody titres in plasma (as measured by neutralization of tissue culture-adapted SIVmac251) before and following infection of controller vs. non-controller RM among Group A-C and the concurrent Group D RM (RP = rapid progressor). The significance of the differences in log change in Ab titre from pre-infection to day 112 pi in Group A and B controllers vs. Group C RM was determined by the Wilcoxon rank sum test. c, Analysis of the change in the SIVgag-specific CD4+ and CD8+ T cell response frequency following controlled vs. progressive infection in Groups A, B and C with the significance of differences in peak response boosting between the designated groups determined by the Wilcoxon rank sum test.

