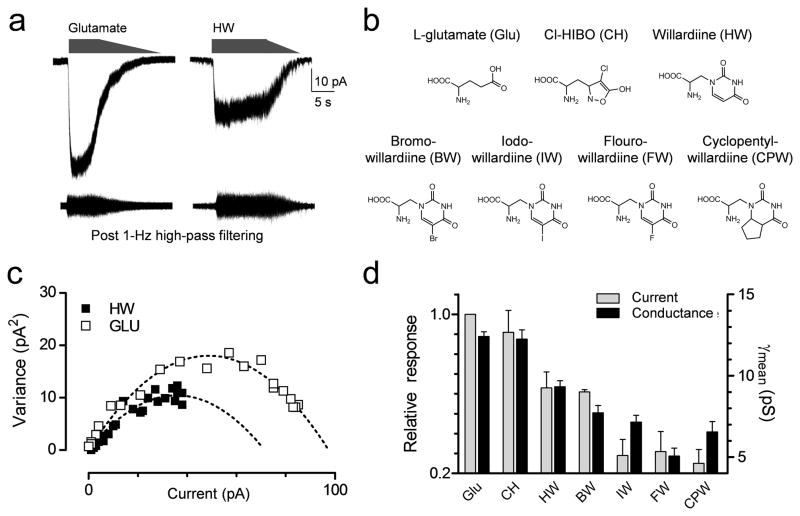
Figure 3.
Phosphorylation of GluA1-Ser831 changes γMEAN independent of agonist efficacy. A. Example of macroscopic currents and isolated difference currents for glutamate and willardiine activation of recombinant GluA1-L497Y in the same patch from HEK cells. B. Structures of the agonists used. C. The current-variance relationships are superimposed for glutamate and willardiine. D. There is a correlation (R = 0.95, p = 0.001) between the maximal response induced by agonists (expressed as a ratio to current induced by maximally effective glutamate) and the γMEAN obtained from variance analysis. Data are from 5–22 patches for each agonist.

