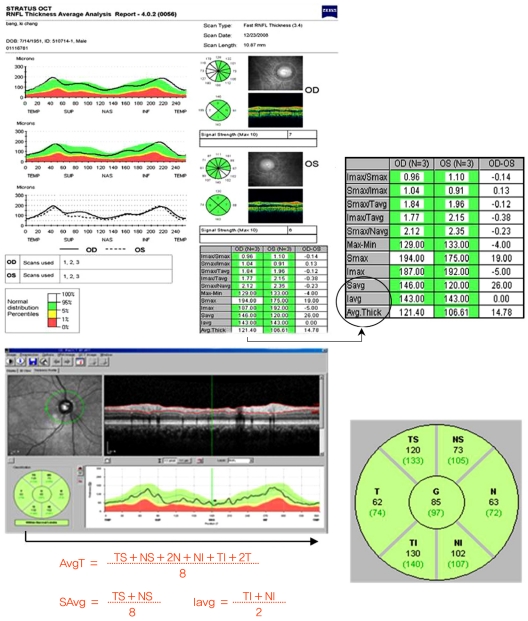
Fig. 1.
Example Stratus time domain-optical coherence tomography (OCT) and Spectralis spectral-domain-OCT scan image and retinal nerve fiber layer thickness map display in the eye of a healthy participant. Imax = inferior maximum; Smax = superior maximum; Tavg = temporal quadrant average thickness; Navg = nasal quadrant average thickness; Savg = superior quadrant average thickness; Iavg = inferior quadrant average thickness; Avg.Thick = thickness measurements of average; TS = temporal superior thickness; NS = nasal superior thickness; N = nasal thickness; NI = nasal inferior thickness; TI = temporal inferior thickness; T = temporal thickness; G = global thickness.

