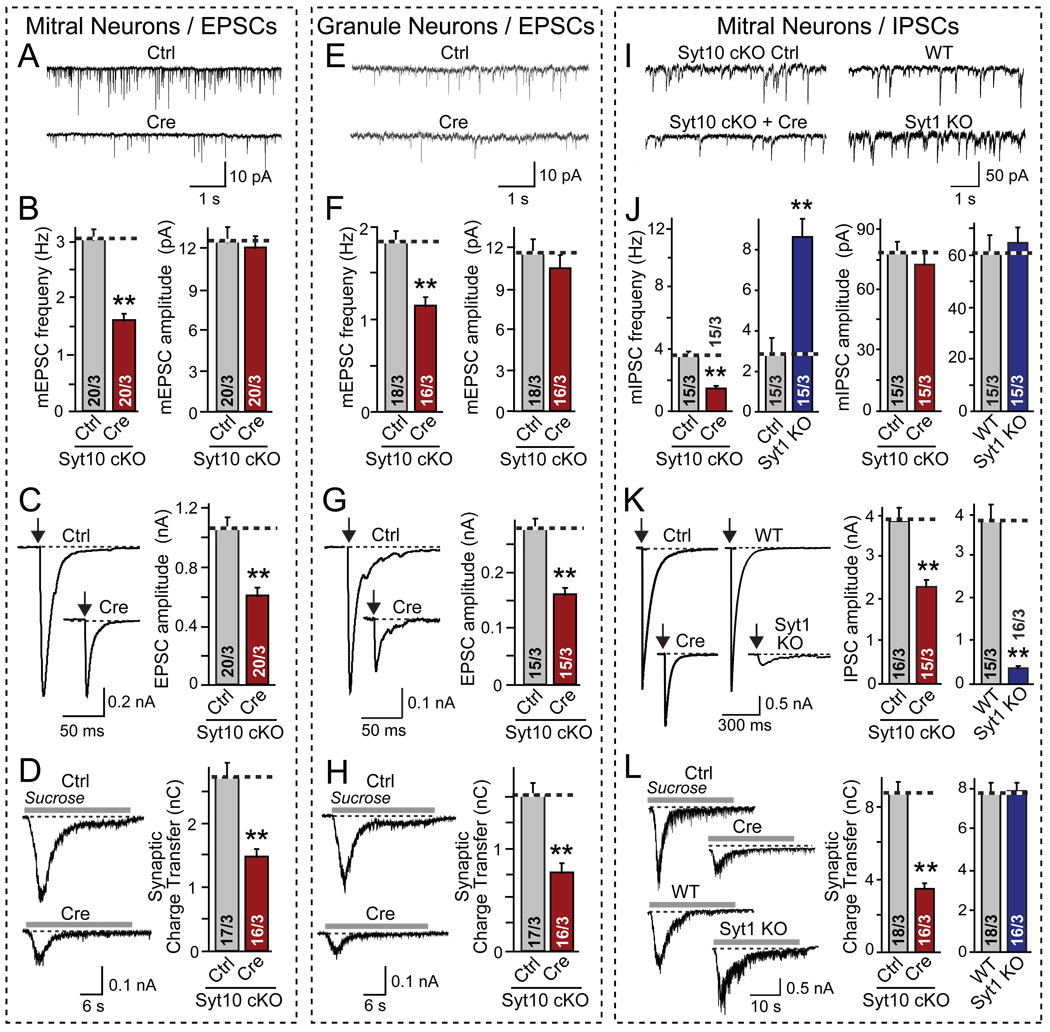
Figure 3. Conditional Syt10 KO decreases synaptic strength as analyzed in cultured olfactory bulb neurons.
Olfactory bulb neurons were cultured from conditional Syt10 KO mice (Syt10 cKO), infected at DIV2–3 with lentiviruses expressing inactive (Ctrl) or active Cre recombinase (Cre) for acute deletion of Syt10, and analyzed on DIV14–16 by whole-cell patch-clamp recordings from large (primarily mitral cells, A–D and I–L) or small neurons (primarily granule cells, E–H; for validation of neuronal types, see Fig. 4). Excitatory (A–H) and inhibitory synaptic responses (I–L) were recorded in 50 µM picrotoxin or 20 µM CNQX and 50 µM D-APV, respectively. Parallel experiments were performed with mitral neurons cultured from littermate wild-type (WT) and Syt1 KO mice as shown in panels I–L.
A & B, Representative traces (top) and summary graphs of the frequency and amplitude (bottom) of spontaneous 'mini' exitatory mEPSCs recorded in 1 µM tetrodotoxin in mitral neurons (red = Syt10 KO; blue = Syt1 KO).
C. Representative traces (left) and summary graphs of the amplitudes of evoked EPSCs (arrows = action potential).
D. Representative traces (left) and summary graphs of the total charge transfer (right) of EPSCs evoked by application of 0.5 M sucrose (gray line) in 1 µM TTX.
E – H. Same as A–D, except that excitatory synaptic responses were analyzed in granule cell neurons.
I – L. Same as A–D, except that inhibitory synaptic responses were analyzed in mitral cell neurons, and Syt1 KO neurons were analyzed in parallel.
All summary graphs show means ± SEMs; number of cells/number of independent cultures analyzed are shown in individual bars. Statistical analyses were performed by Student's t-test comparing the cre-recombinase treated and control neurons (**=p<0.01).

