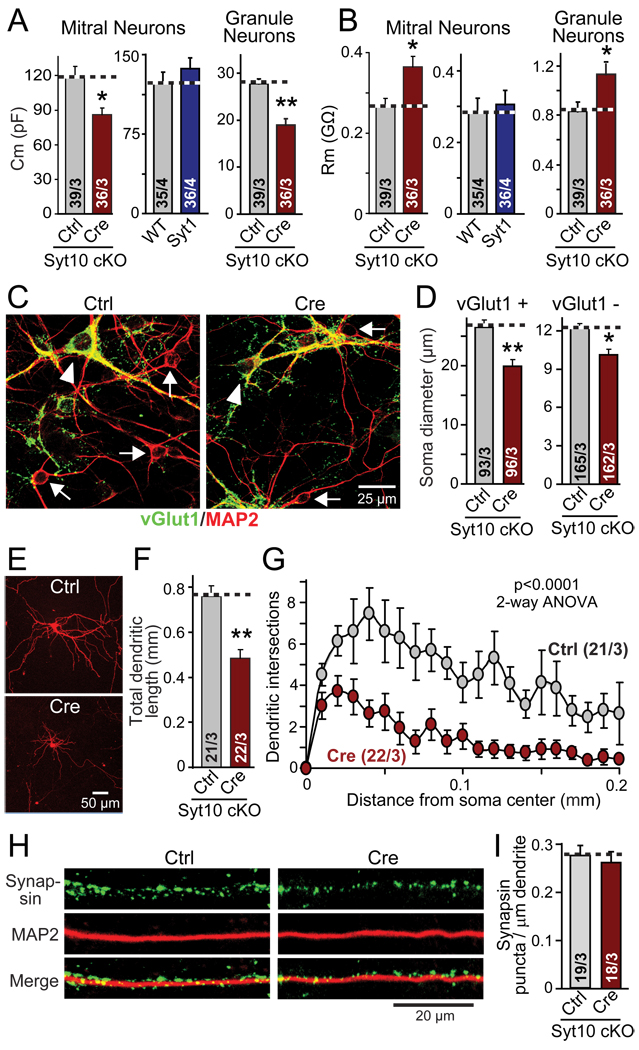
Figure 4. Syt10 KO decreases neuronal size and arborization but not synapse density per dendritic segment.
Olfactory bulb neurons were cultured as described for Fig. 3
A & B. Capacitance (Cm) and input resistance (Rm) measurements from mitral and granule cell neurons of Syt10 and Syt1 KO neurons compared to controls.
C. Representative images of control and cre-recombinase expressing conditional Syt10 KO neurons stained for the excitatory marker vGlut1 (green), and the neuronal marker MAP2 (red; yellow = overlap; arrowhead = vGlut1 positive cell bodies; arrows = vGlut1 negative cell bodies).
D. Size of the soma of neurons expressing (vGlut1+) or lacking the excitatory marker vGlut1 (vGlut1−), to identify the former as the larger mitral and tufted neurons, and the latter as primarily composed of the smaller granule cell neurons.
E–G. Representative images of mitral neurons expressing tdTomato (introduced by transfection at DIV7; E); measurements of the total dendritic length of such neurons (F); and Sholl analysis of dendritic branching of these neurons (G).
H & I. Representative immunofluorescence images of the dendrites of mitral neurons (left), and summary graph of the synapse density on such dendrites (right). Cultured olfactory bulb neurons were stained for MAP2 and synapsin, and the synapse density on representative dendritic sections were quantified.
Summary graphs depict means ± SEMs; number of cells/independent cultures analyzed are shown in individual bars. Statistical analyses for summary graphs were performed by Student's t-test comparing the cre-recombinase treated neurons to control neurons (*=p<0.05; **=p<0.01), except for G, which was assessed by 2-way ANOVA.

