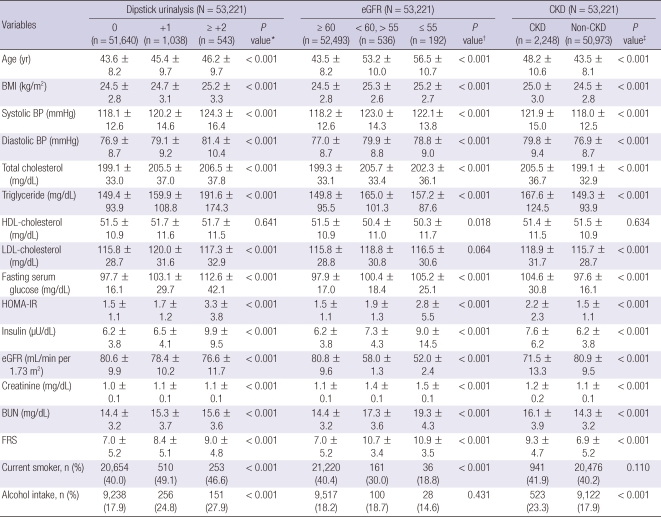
Table 1.
Comparison of baseline characteristics of proteinuria, eGFR and CKD (N = 53,221)
All values are the mean ± SD or the number of subjects (percent of the total). The dipstick urinalysis of trace was regarded as absent. *P value by ANOVA-test for continuous variables and Chi square test for categorical variables among dipstick urinalysis categories; †P value by ANOVA-test for continuous variables and Chi square test for categorical variables among eGFR categories; ‡P value by t-test for continuous variables and Chi square test for categorical variables between CKD and non-CKD. BMI, body mass index; BP, blood pressure; HDL, high-density lipoprotein; LDL, low-density lipoprotein; HOMA-IR, Homeostasis Model Assessment of insulin resistance; eGFR, estimated glomerular filtration rate; BUN, blood urea nitrogen; FRS, Framingham risk score.

