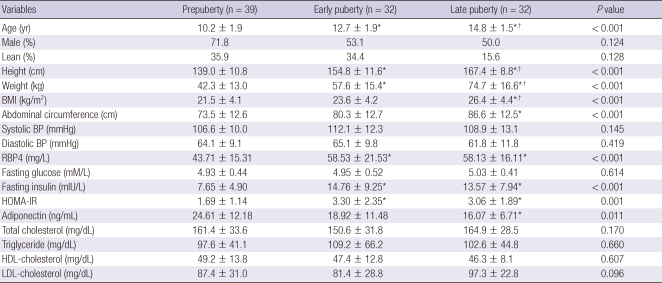
Table 2.
Clinical and metabolic variables of prepuberty, early puberty and late puberty groups
Data are shown as mean ± standard deviation and number. P values were calculated by ANOVA's test. For multiple comparison, Tukey procedure was done. *P < 0.05 compared with prepuberty group; †P < 0.05 early puberty vs late puberty group. BMI, body mass index; BP, blood pressure; RBP4, retinol binding protein 4; HOMA-IR, homeostatic model assessment of insulin resistance.

