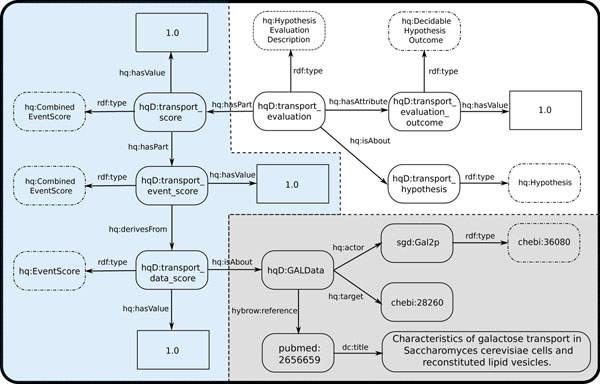
Figure 1.
A representation of the RDF output describing the evaluation of the galactose transport hypothesis. The figure shows how evaluation results are linked to the experimental data used to support the hypothesis. Rounded rectangles with solid lines are class instances; rounded rectangles with dotted lines are ontology classes; rectangles are literals. The grey section shows the experimental GAL system data (from the HKB) used to evaluate the hypothesis, including source literature. The blue section shows the scores resulting from evaluating the galactose transport hypothesis. The white section shows the summarized evaluation results (decidable, with the overall score). ‘hq:’ is the HyQue namespace; ‘hqD:’ is the HyQue Data namespace; ‘sgd:’ is the Saccharomyces Gene Database namespace; ‘chebi:’ is the CHEBI namespace.

