Figure 3.
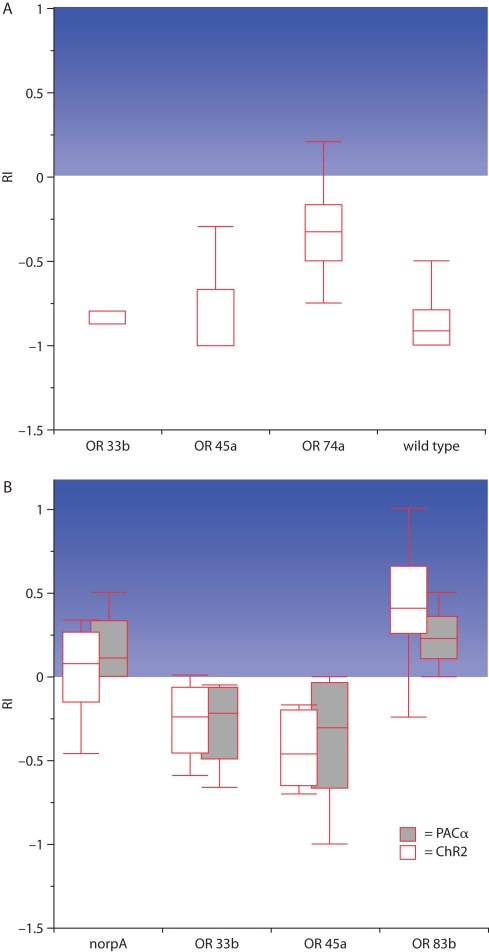
Behavioral responses to blue light in the four-quadrant assay. The response index (RI) indicates the degree of attraction toward the blue illuminated areas of the Petri dish, illustrated by the blue background. (A) Wild type as well as larvae in which ChR2 is expressed in ORNs that endogenously express the receptors OR33b or OR45a strongly escape from the light. In contrast, when ChR2 is expressed in those ORNs that endogenously express the receptor OR74a larvae are significantly more attracted by blue light (n = 20 each). (B) Blind larvae that express ChR2 or PAC α in all ORNs (OR83b) are attracted by blue light, while the expression of the same proteins in single ORNs with the endogenous receptors OR33b or OR45a results in an avoidance of the light. The blind mutant control (norpA) shows no preference (n = 10 each; modified from Bellmann et al., 2010).The median is indicated as line in the box. Boxes locate the 25 and 75 percentiles and the whiskers indicate the minimum and maximum values.

