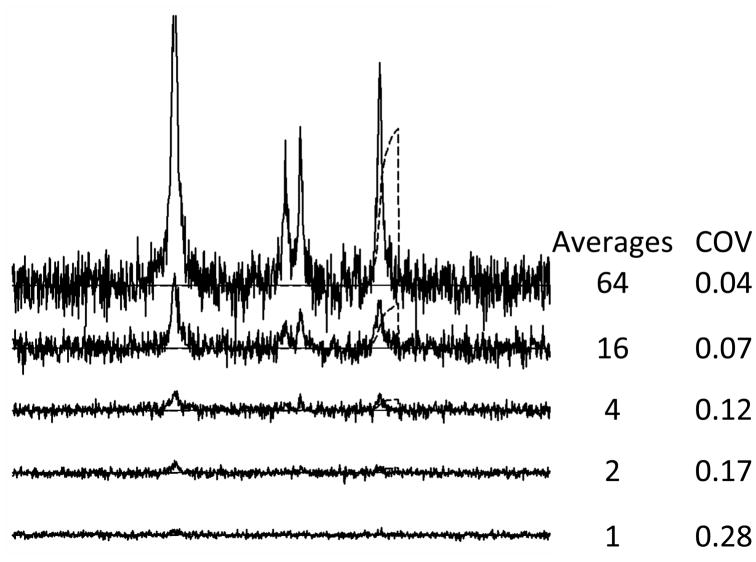
Figure 2.
MRS signal averaging. Number of averages used for each simulation are shown to the right of each simulated spectrum. Coefficient of variance (COV) calculated as standard deviation divided by mean. COV values were determined by repeating each simulation 100 times, measuring the amplitude of the simulated NAA signal by integration as shown and then determining the mean and standard deviation over the 100 amplitude measures.

