
Figure 4.
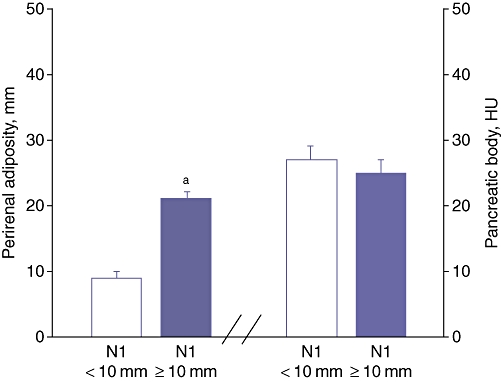
Node-positive patients stratified by perirenal adiposity in mm and computed tomography attenuation of the pancreatic body in Hounsfield units (HU). N0, node-negative patients; N1, node-positive patients; aP < 0.01 vs. N1 + fat pad of <10 mm