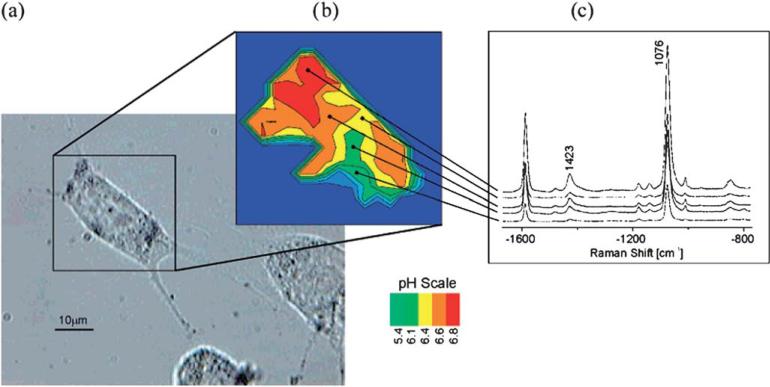
Fig. 10.
(a) White light image of the cell after incubation with nanotags. (b) pH mapping of the cell according to the intensity ratios of Raman bands at 1423 and 1076 cm–1. (c) SERS spectra obtained in endosomal compartments of different pH values.139 Reproduced by permission of The American Chemical Society.

