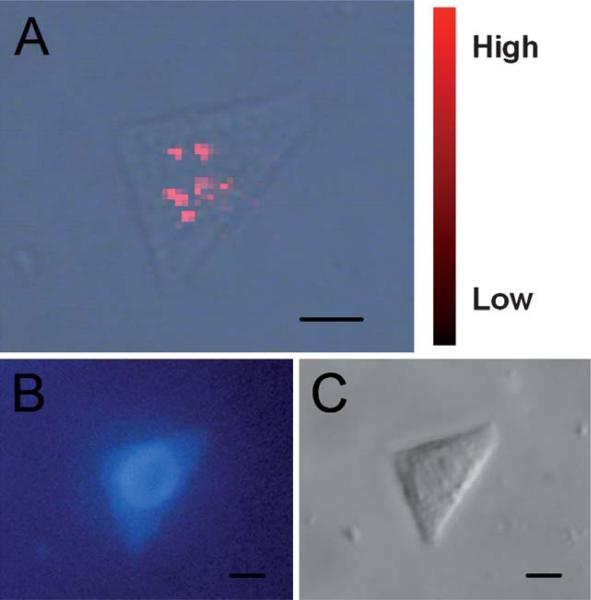
Fig. 3.
(A) Merged SERS image made up of a SERS map and an optical transmission image. (B) Fluorescent image of the cell after nuclear staining by Hoechst 33258. (C) Differential interference contrast micrograph of the cell. Scale bar: 10 μm.93 Reproduced by permission of The American Chemical Society.

