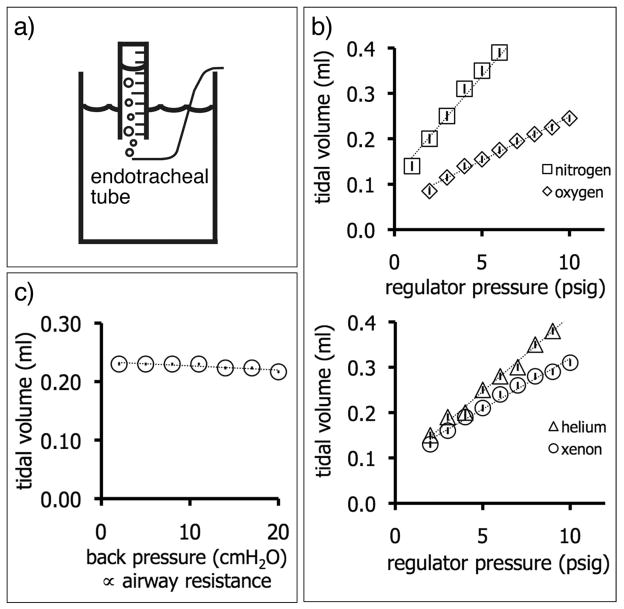
Figure 4.
Measurement of tidal volume. a) A small graduated cylinder is filled with water and placed upside down in a water bath. The output of the endotracheal tube displaces water from the graduated cylinder and allows the tidal volume to be determined over a fixed number of breaths. To test robustness against impedance changes, the gas output can be placed increasingly deeper in the water bath to increase the back pressure. b) Nitrogen and oxygen tidal volumes increase in linear proportion to the driving pressure. The vertical bar within each marker shows the standard deviation of the data fitted linearly. In this example, the tidal volume of nitrogen increases with a slope of 44.0 ± 1.3 μl/psi, indicating the precision with which the tidal volume can be adjusted. c) The tidal volume dispensed remains largely constant regardless of back pressure. The vertical bar within each marker shows the standard deviation of the data fitted to a straight line. The decrease in tidal volume versus back pressure is negligible, at 0.70 ± 0.17 μl/cm H2O.

