Fig. 1.

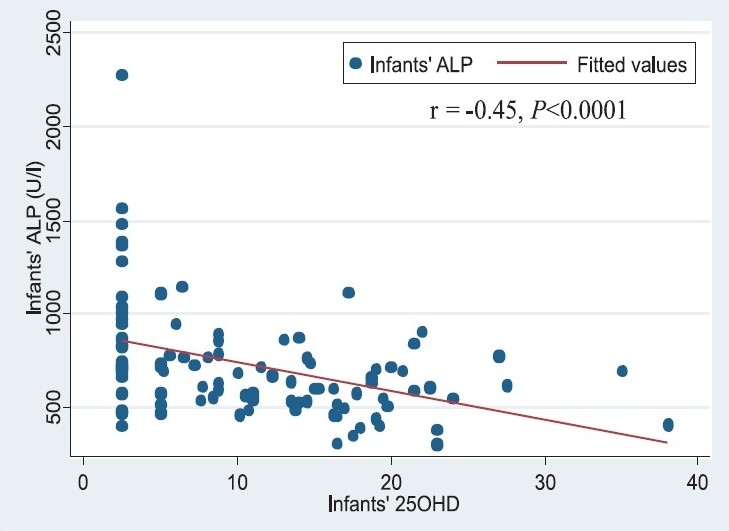
Scatter plot describing the relationship between infants’ serum 25OHD and alkaline phosphatase (ALP) concentrations (r= -0.45, P< 0.001).

Scatter plot describing the relationship between infants’ serum 25OHD and alkaline phosphatase (ALP) concentrations (r= -0.45, P< 0.001).